
Whether you’re the buyer or the seller, a life settlement can reshape your finances in short order. Unfortunately, not all investors and policyholders have access to the same level of life settlement opportunity. That’s because the secondary markets for life insurance vary in size and activity level from state to state. In our latest study, the Harbor Life Settlements U.S. Life Settlement Index, we set out to quantify those differences and identify the states that are most and least accommodating to life settlements.
The U.S. Life Settlement Index ranks the 50 states on seven weighted attributes that affect life settlements. These are median household income, average life expectancy, the size of the population aged 75 or older, the median monthly cost of long-term care, the face amount of life insurance per capita, whether the state regulates viatical settlements and life settlements, and whether the state requires life settlement disclosures to policyholders.
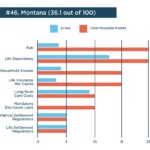
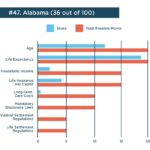
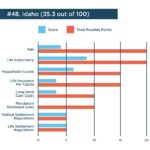
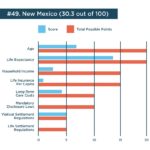
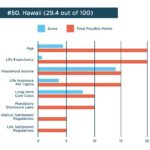
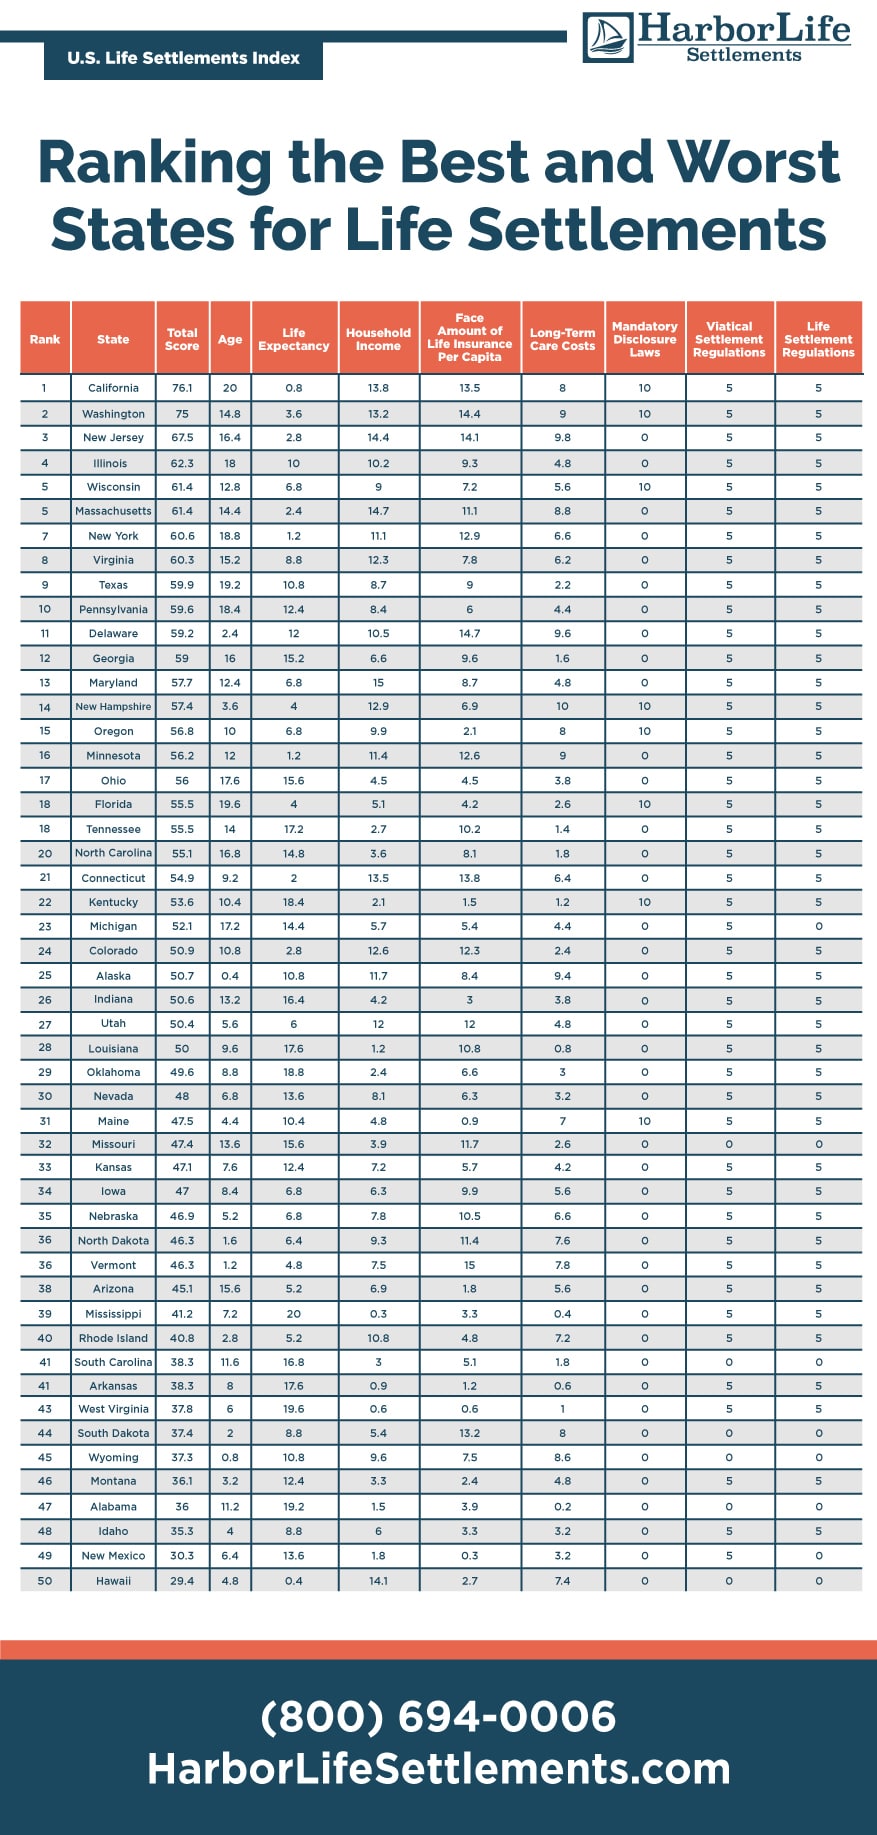
Based on those factors, California comes out on top as the state most favorable to the life settlement industry. Behind California are Washington, New Jersey, and Illinois, with Wisconsin and Massachusetts tied for fifth on the index. Hawaii ranks the worst among the 50 states, and New Mexico, Idaho, Alabama, and Montana are also in the bottom five.
The presence of state regulations proved to be an influential factor in the ranking. The six states ranking in the top five spots all have regulations in place for life and viatical settlements, and three have mandatory disclosure requirements.
States that rank poorly generally have low regulatory scores as well as below-average performance across multiple factors, including the face value of life insurance per capita, the size of the senior population, median income, and median cost of long-term care.
Surprisingly, three of the bottom-five states scored well on life expectancy with shorter-than-average lifespans. A shorter average lifespan increases life settlement activity because it makes life insurance more attractive to investors. In those three low-ranking states (Montana, Alabama, and New Mexico), the shorter lifespans weren’t enough to offset other factors.
Ranking the best and worst states for life settlements
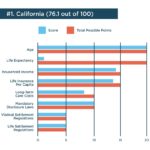
California determined the best state for life settlement opportunity
California earns the top spot on the U.S. Life Settlement Index with a score of 76.1. Golden State residents earn a higher-than-average living, with a median income of $80,440. They do carry slightly less life insurance than second-ranked Washington and third-ranked New Jersey, and the median cost of monthly long-term care is also lower. But California still rises to the top of the index on the strength of its life settlement disclosure requirements and the number of state residents aged 75 and older, which is nearly 2.5 million.
California’s massive population of wealthy seniors should drive life settlement activity in the years ahead. While the state’s monthly median long-term care costs of $5,339 are slightly lower vs. Washington and New Jersey, those costs are still about 13% above the national average. To fund those care expenses, many California residents will look to liquidate their life insurance for maximum cash proceeds in a regulated life settlement.
The rest of the best
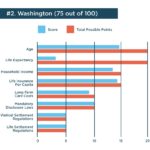
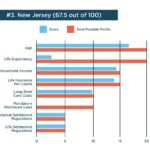
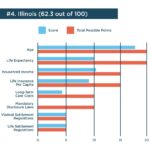
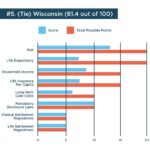
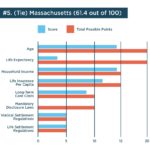
Washington, New Jersey, and Illinois are just behind California for life settlement opportunity, respectively ranking two through four on the index. Wisconsin and Massachusetts round out the top five with a tie in the fifth-ranking spot. As noted, all of these states do regulate life and viatical settlements. California, Washington, and Wisconsin also require life settlement disclosures to life insurance policyholders.
Among these top-ranking states, only California and Washington are close in cumulative scoring, separated by 1.1 points. There is a 14.7-point difference between top-ranked California and fifth-ranked Illinois and Wisconsin. The lack of mandatory disclosure laws in New Jersey, Illinois, and Massachusetts contributed to that point spread.
Washington has a smaller elderly population relative to New Jersey and California. But the state does have the fifth-highest long-term care costs and the third-highest face amount of life insurance per capita nationwide. The life expectancy in Washington of 80.3 years is on par with New Jersey, but a year shorter than California.
New Jersey residents enjoy the third-highest median household income in the country and the fourth-highest life insurance value per capita. The population of those aged 75 or older is about 642,000 and the average life expectancy is a moderate 80.5 years. The state’s median monthly cost of long-term care ($6,400) is above average, too.
Illinois has the country’s sixth-largest population of residents aged 75 and over, at about 867,000. The Prairie State also gets a boost on the index for its average life expectancy of 79.3 years. While that number is above the national average, it’s the shortest among the states ranked in the top five. Relative to the country as a whole, Illinois also has a higher-than-average household income at $69,187 and life insurance per capita, at $9,447.
Wisconsin and Massachusetts earned the same index score of 61.4, but for different reasons. Massachusetts has the second-highest median household income in the country at $85,843. Despite that high income, residents of the state carry about 30% less life insurance per capita than Vermont, which has the highest rank nationwide on this metric. Massachusetts’ population of seniors aged 75 or older totals about 470,000 and the state’s average life expectancy is relatively long at 80.7 years.
Wisconsin has a significantly lower household income than Massachusetts, as well as a smaller population of seniors aged 75 and older, lower long-term care costs, and less life insurance per capita. But life expectancy in Wisconsin is shorter at 79.6 years, and Wisconsin does require disclosures to life insurance policyholders about life settlements.